A Network Diagram is b nothing but a visual representation of a project schedule. It helps in project planning and controlling the project from start to end. It helps find a critical path, critical activities, free float, total float, and much more on a project schedule.
You may be interested in PERT.
Quick Navigation
Types of Network Diagrams | ADM & PDM
We have two types of network diagrams, namely;
- The arrow diagram method – ADM
- The precedence diagram method – PDM | AON | AOA
Arrow Diagram Method – ADM
In ADM, arrows represent the project activities like a tail is for the start of the Activity and ahead for the finish. The arrow length represents the duration of that Activity.![]()
PDM | AON | AOA
PDM is also called Activity on a node – AON, and Activity on Arrow – AOA is a particular type of PDM.
In PDM, we have relationships or dependencies that help to make reports for different project stakeholders. Like, if a contractor has to wait for another contractor to finish the job first, they can start on. This makes life easier for a project manager.
The Activity on Arrow (AOA) diagramming method has all the activities with only one FS- Finish to Start relationship. In the Program evaluation review technique – PERT, we use AOA diagrams.
Below is a simple comparison between AOA and AON for easy understanding. Make sure the circle may be rectangles, square, or any proper, consistent shape.
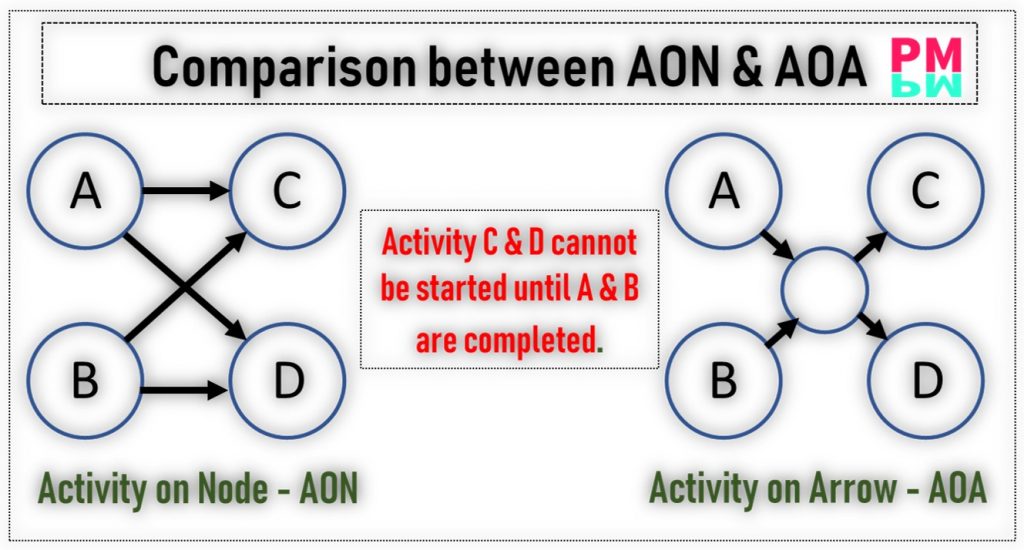
AOA diagram usually shows milestones or events as duration is zero, and the AON is better to represent tasks in a network diagram.
I hope all these terminologies a crystal clear now. Let’s see PDM in more detail.
Types of Relationship | PDM
As I said earlier, the arrows in PDM represent the relationships between the activities. That relationship can be one of the following:
- Finish to Start – FS
- Start to Start – SS
- Finish to Finish – FF
- Start to Finish – SF
Let us dig more in to these with easy examples.
Finish to Start – FS
In this type of relationship, the next Activity (successor) cannot be started until the first (predecessor ) completes. This one is most commonly used in PDM. More than 75% of relationships in a schedule are Finish to Start. They also call it a natural relationship.

Example: Floor tiling can not be started until the Waterproofing is done. Or let see another example: A slab work cannot be started before completing the column work.
Start to Start – SS
In this type of relationship, the next Activity (successor) first one (predecessor ) has to be started simultaneously. Start to start a relationship is helpful while crashing a schedule. Some people may be thinking that a SS Relationship is a Must Start Together. So, if one of the activities Starts, another one should automatically start.

Example: If Paintworks is started on one floor of a tower, then you can start paintwork on the other floor if ready. This will save time in your schedule. But most of the time, as I said, the SS relationship is the best for fast-tracking.
In another way, let say a floor is released from another contractor and is ready for your paintwork, then it is a must start to start a type of relationship.
Finish to Finish – FF
In this type of relationship, the next Activity (successor) first one (predecessor ) is completed simultaneously. Normally, this relationship is used for connecting to a finish milestone.

Example: You are asked to finish a concrete job on floor 10, and the client put it as a milestone on your schedule. Once you complete the last Activity like poring on concrete, this milestone will be automatically achieved.
Start to Finish – SF
In this type of relationship, the first one (predecessor ) cannot be started until the successor is completed. Make sense!
This one is a highly undesirable relationship in any schedule. But is being used in some schedules.

Examples: It is tough to find examples of this particular relationship. Let’ see below one and try to understand the stuff.
- A security guard cannot start his duty unless the other one finishes. To be more specific, starting a new shift is a signal to finish the current security guard’s change.
- In any shift work, the reliever has to arrive, clock in, and start his turn before the extant shift worker can clock off and end his shift. But if the reliever is late, the existing change can’t finish. It can only finish once the following task has started.
I hope you are quite clear about these examples. If you can add more examples, then please mention them in the comment.
Conditions for a Network Diagram
These conditions must fulfill to develop a network diagram;
-
- Activities should be clearly defined for the complete scope of a project.
- Logic must be there among activities.
- Time estimation of all activities should be done already.
Benefits of Project Network Diagrams
- It helps to estimate time accurately.
- Helps to make proper decisions
- Helps to find opportunities for optimization
Wrap Up
AOA, AON, PDM, and ADM terms will not bother your head anymore. It was a tough ask for me when I was preparing for my PMP exam. A network diagram makes things easy for a project team as it clearly visualized the things for them. Also, remember that planning tools like Primavera P6, MS Project, Tilos, and Asta Power Project will automatically make these networks.
FEATURED POSTS