Expected Monetary Value Analysis (EMV) is a statistical technique used to quantify the risks. This technique helps in determining the overall contingency reserve required. That contingency reserve is then made part of a complete project plan.
Risks can be categorized as opportunities and threats. Opportunities are expressed as positive Risk values, whereas threats are expressed as negative risk values. For risk assessment, it must have a risk-neutral assumption for proper judgment between opportunities and threats.
Quick Navigation
We use two things here.
- Probability
- Impact
First, we need to understand these…
What is Probability?
It is the likelihood of the occurrence of any event.
For example, the Head’s outcome in a toss is 50% & so does 50% is the tail.
This we get as the total number of events is 2, the likelihood for Head or tail is 1/2.
Same way, if we roll a dice, then the likelihood for any number like to get a 3 is 1/6 as entire faces on dice are 6. This makes 16.67% chances to get any number on a dice.
Hope Probability is clear.
What is Impact?
This is simply the money that you need to deal with that identified risk if it occurs.
For example, during the project’s execution, you identify that there may be a breakdown in the equipment, and you need to replace it with a new one. And the cost of new equipment is 5000 $. This is the impact value.
It can be a cost impact or the schedule impact (Time is money).
How is EMV Calculated?
Expected Monetary Value for any project is calculated by multiplying the probability of each outcome occurring by the Value of each possible outcome & its Impact:
EMV = P x I
P = Probability of each outcome occurring.
I = Value of each possible outcome
Simple example;
I will try to explain all these concepts through a fundamental example;
Step – 1: Get all the activities/tasks, resources cost from the Bill of Quantity (BOQ)
Step – 2: Analyze all the risk factors related to the project
Step – 3: See the Probability of all the risks. Opportunities & threats both
Step – 4: Calculate the Contingency reserve for all identified risks
Step – 5: Sum up all, and you are done
Let see in the below table; we have identified 5 risks. Risk 2 & 3 are the opportunities that we need to exploit to happen, and the other three are threats that we need to mitigate, avoid, or transfer.
| Risk | Probability | Impact ($) | EMV (P*I) |
| 1 | 13% | -10,000 | -1300 |
| 2 | 10% | 20,000 | 2,000 |
| 3 | 25% | 25,000 | 6,250 |
| 4 | 15% | -2,50,000 | -37,500 |
| 5 | 80% | -1,500 | -1200 |
| -2,16,500 | -31,750 |
We got a figure of an impact of -216500, but this is not what we need to reserve as we will calculate EMV, which is -31750.
This we need to have in reserve as a contingency.
I hope it is quite clear to you now.
Probability & Impact Matrix
As explained above, it is one of the key tools of the Quantitative Risk Analysis process. Its primary purpose is to eventually allocate money in the Cost Baseline (the budget) – i.e., Contingency Reserve to cover the risk. To do this, the qualitative impact scales of the P-I Matrix are converted to actual costs for each risk deemed in the preceding process to be high-priority.
For example, if the 0.40 impact rating shown for the risk in the Matrix below means a “20 – 40% cost increase” and if the total costs estimated for the activities most impacted by the occurrence of this risk is $20,000, then the “impact” in monetary terms is between $4,000 and $8,000 or an
average of $6,000.
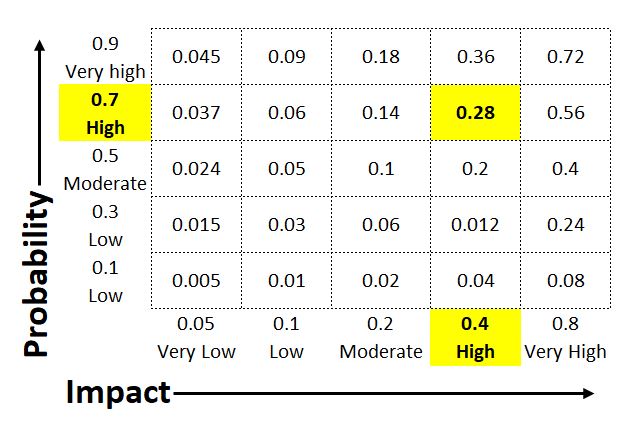
That figure of $6,000 would then be multiplied by the probability of the risk occurring using the Expected Monetary Value equation:
EMV = P x I
EMV = 0.7 x $6,000 = $4,200
Decision Tree
EMV is often used with Decision Trees, and it requires an appreciation of the concept of expected Value or Expected Monetary Value ─ a concept similar to Exposure.
For example, imagine buying a sweepstake ticket for $1.00. There are two possible prizes: $100.00 and $10. 00
- 5% of tickets payout $100.
- 0% payout $10.
- The remaining 97.5% pay nothing!
| Prize Value | Probability of winning | Average return |
| $ 100.00 | 0.005 | $ 0.50 |
| $ 10.00 | 0.02 | $ 0.20 |
| $ 0 | 0.975 | $ 0 |
| Total | 1.000 | $ 0.70 |
The average outcome for any single bet is in the above-cited example is $0.70. This average outcome” is called the Expected Value.
We can never win the expected Value on a single bet, but if we repeated the chance many times, we would, on average, receive $0.70 for every $1.00 wagered.
There are many good things about this technique as this gives us;
- The average outcome of all identified risks.
- Contingency Reserve.
- The basis for make or buy decisions.
- The basis for making decisions keeping in view the historical data.
Similarly, there are some shortcomings in these processes, such as
- Its use is only limited to bigger projects, so it can’t be used for small projects.
- It’s a heavy reliance on historical data and expert opinions, so personal liking disliking can affect the project’s overall result.
- Incorrect historical data will eventually impact the project.
- Less information on the. Risks will eventually result in a higher impact of individual risk, which might not be correct.
Summary
Risk analysis of any project cannot be completed without putting some amount as a contingency reserve. As a project manager, you always feel confident once you have a better risk analysis and some reserves in hand.
FEATURED POSTS
Great article!
Just replace “EVM (P*I)” with “EMV (P*I)” in the first table.
Thanks, Yassine. Corrected