The 7 basic quality tools are also known as ‘The Old Seven’ and ‘The First Seven.’ Kaoru Ishikawa, a professor at Tokyo University, is considered the father in quality and emphasized these quality tools.
These 7 basic tools are a set of graphical representations with statistical techniques. These are very helpful in solving queries related to quality. One can apply these tools after simple training. These tools helped Japan during the quality revolution.
Though these tools are old but are effective with the same popularity, quite interestingly, The Deming Chain (Reducing costs through process improvement), Six Sigma, Lean Project Management (waste reduction), etc., use these tools for improvement.
Quick Navigation
What are Basic Quality Tools?
Nowadays, several organizations make sure to use these tools. This helps to monitor and ultimately manage quality initiatives.
In today’s market, we see many types of controlling tools. But the old seven tools for quality control that are very common as a different tool is used for different problem-solving techniques. Hence, you have to juggle and find the right one for any particular issue on a project or process.
Being a manager, if you are familiar with and know well how to implement these tools, then life is quite easy – on the job, at least!
These tools are namely;
- Cause and Effect Diagrams
- Flow Charts
- Checksheets
- Histograms
- Pareto Charts (80/20 Rule)
- Control Charts or Shewhart Chart
- Scatter Diagrams
Let us see one by one in detailed scenarios;
Cause and Effect (Fish Bone) Diagrams
The Father in ‘Quality Circles’ Professor K. Ishikawa, was the first to develop the Cause and Effect Analysis in the 1960s.
Brainstorming is done, and then a diagram is developed after all of the possible causes of a problem. In this way, a thorough analysis is done of any specifics of the situation. This method is best when dealing with complicated issues. It is also known as the ‘fishbone diagram’ as the final shape looks like a fish Skelton.
How to Draw Fish Bone Diagram
The following steps are to follow to get a fishbone diagram;
Step – 1: Identify the problem you are trying to solve
Step – 2: Write it on the head of the fish
Step – 3: Write the significant causes of the problem on the spine of the fish
Step – 4: Make categories of people, processes, materials, and equipment.
Step – 5: Do brainstorming and find a group familiar with the problem
After you are done with all the above steps, analyze, modify if required in categories, and resolve the identified problem.

Make sure that there may many causes as your project like the client, management, environment, etc. The purpose of this fishbone diagram is to identify all the reasons behind an effect.
How to Use Fish Bone Diagram
Analyzing the diagram will help you to find out;
- To Identify the problem.
- To work out the major factors.
- Identify possible causes.
Note: You can download the template late from here. Cause and Effect Diagram Template Downloaded and modified from PowerPoint School.
Flow Charts
Everyone is familiar with flow charts nowadays, as an organization’s hierarchy is the most common example of any flow chart. It gives the idea of reporting structure inside any organization.
But, here, we are going to discuss flow charts that are used for process flows. This tool is the best to find out any bottleneck in a process flow. It shows how a process looks like and going through the steps. These charts also help to improve the process as well.
Benefits of Flow Chart
- The Simplest of all flowcharts
- Use for planning new processes or examining an existing one.
- To keep people focused on the overall scenario.
- Displays what happening at each step
- Indicates what happens when non-standard events occur
- Graphically display any wasted effort.
How to Draw a Flow Chart
- First of all, enlist all major steps.
- Write them across the top of the chart.
- Now enlist sub-steps under each in the order they occur.
- Write the process step inside each symbol.
- Connect the Symbols with arrows showing the direction of flow

Checksheets
The check sheet is one of the simplest of 7 basic quality tools. Here, use it to collect data. For example, we use a checksheet to track the number of times a certain event/incident is happening.
A checksheet is also called a telly sheet. It is NOT a checklist!
Information is collected in quantitative form. We listed down all the important checkpoints in a tabular form in checksheets and kept updating the status. This helps to understand the progress pattern and helps to find the causes of defects.
As an example, the Project management institute may track the number of questions by the student, per domain, per minute is answering. This will help them make a test that can be solved in a time-effective manner and is logical. If students take a particular question to crack, they will be eliminated from the database to make it more exam-proficient.
In the same pattern, other processes can be dealt with for improvement.
Benefits of Check Sheets
- The best tool for collecting and organizing measured data
- The data collected helps for input for other quality tools.
- Collect data in a systematic and organized manner
- It helps to determine the source of the problem
- Helps to facilitate classification of data (stratification)
Histograms
Karl Pearson introduced a bar graph representing the frequency distribution on each bar with time. A histogram helps to see the density of data. Ultimately this distribution leads to find the causes of major incidents.
Difference between Histogram & Pareto Charts
A histogram is a bar chart representing each attribute in a column and its frequency occurring as the column’s height.
A Pareto chart always has an arc for the cumulative percentage of the issues. A Pareto helps to prioritize corrective actions.
Example of a Histogram
I will explain here all with an example, although it is quite clear from the histogram. You can see which is basically a delay analysis for the delay on a different project. If you see, data was collected from all over the project—segregated, keeping in view these top categories.
Here, you can download the Histogram Template. 
Once data was uploaded in Microsoft Excel, histogram peaks clearly show the procurement department’s major issue. It does not mean that no other one is hampering the situation but a clear indication that the top management will work on procurement issues.
Hence, a histogram helps to prioritize the issues to present to the top management to deal with as soon as possible.
There is a limitation to draw a histogram. You should have enough data to draw and drive the results. It may mislead if you don’t have enough data.
Pareto Charts (80/20 Rule)
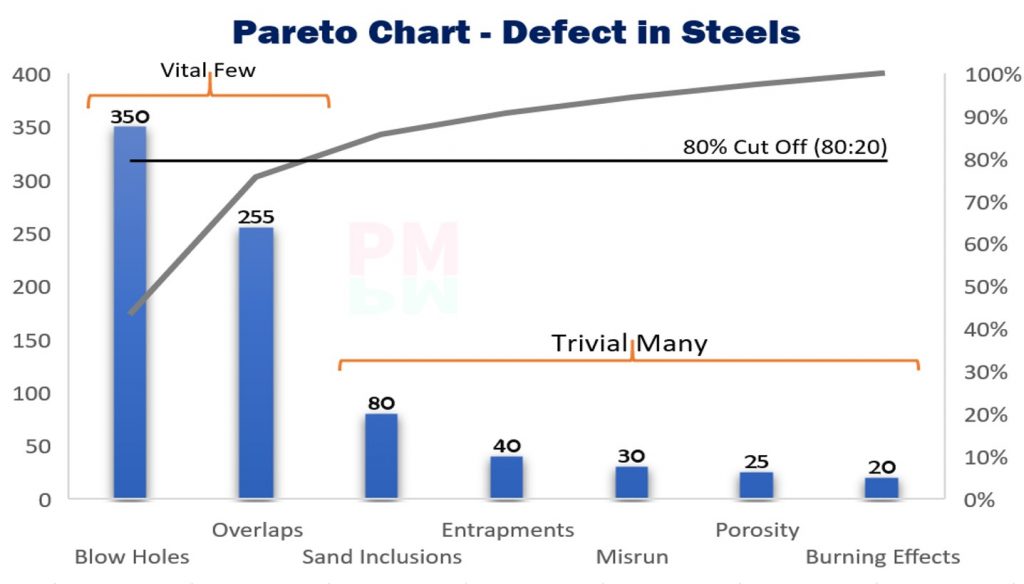
A Pareto chart is a bar graph of data showing the largest number of frequencies to the smallest and a cumulative percentage, as shown in the graph below.
In this example, we look at the number of product defects in each of the listed categories.
When you look at the number of defects from the largest to the smallest occurrences, it is easy to prioritize improvement efforts.
How to Draw a Pareto Chart
To draw a Pareto chart is quite simple. The major part is collecting the right data. Pareto Chart Template
Steps to make a Pareto Chart
In the below chart, I need to find the major root cause of my quality issues related to the steel industry during the casting process.
You can download the TemplateTemplate and follow along the below steps;
- First of all, I collected the data from Quality logs.
- On MS Excel, I entered the data in high to low order.
- It also calculated the cumulative percentage.
- Then draw the graph from the insert section.
- Segregate the data as per their categories.
- Analyzed and found Vital few and Trivial many.
- Cut 80:20
When to Use Pareto
Pareto Charts can be valuable when
- Analyzing data about the frequency of problems in any process
- You have many issues and need to find the most significant.
- Analyzing major causes
- To make a report for top management.
As explained in Histogram, the Pareto charts should not be mixed with those. Pareto charts have a cumulative percentage curve as well, categorized from high to low level.
Pareto charts are like a thumb rule where you want to get an instant result to take action.
Control Charts (Shewhart Chart)
A control chart is a statical chart, also called Shewhart Chart, named after Walter A. Shewhart.
This is one of the best tools to understand the fluctuation in a process over time. It is also called a run chart or a time series plot. It helps to find when and how o take action on set limits. Contro charts help to find the consistency of any process.
How to Draw a Control Chart?
First of all, we have to get the calculations for that particular process. You can download the Control Chart Template.
- Find the Mean – Average of those calculations (Target)
- Then, set Upper Control Limit – UCL.
- After that, set Upper Control Limit – UCL.

How to Conclude?
A process is out of control and needs immediate attention when;
- Suppose there is a single point outside the limits of UCL or LCL. Like in the above graph, 3rd point is at the upper control limit.
- A run of eight in a row is on the same side of the mean.
- Persistent patterns that suggest something unusual about your data and your process.
You can see in the below graph; a run can help you find consistency in your process. We set the Control Limits to not bother about all the stuff of our process.

Scatter Diagrams
A scatter diagram or scatter plot is also a statistical tool. It uses variables like dependent variables on Y-Axis and Independent Variable on X-axis plotted as dots on their common intersection points. By joining these plotted dots, we can get any relationship between these variables or an equation in format Y = F(X) + C, where is C is an arbitrary constant.
A scatter diagram is used to find the root cause of any problem, but only if there is any relationship.
You can download here the Scatter Chart Template.

The above graph explains a positive relationship with the time a village is getting populated. These relationships can be linear, exponential, quadratic, logarithmic, polynomial, etc. The variables can be positively or negatively related, defined by the equation’s slope derived from the scatter diagram.
When to use the 7 QC Tools?
It is not an easy question, but if your concepts are clear enough, you will enjoy using all the tools. let see how and where we can use these tools effectively
Flow Chart: Defining a Process
Fishbone Diagram, Pareto Chart, and Control Charts: Measuring Phase
The Control Chart: Process Improvement Phase
The Scatter Diagram, Histogram, and Checksheets: Analyzing Phase
FAQ’s About 7 QC Tools
Question: What are the major causes of the fishbone diagram?
Answer: These are considered to be the major ones;
- People
- Methods
- Machines
- Material
- Measurements
- Environment
Question: These tools are only for the process industry?
Answer: No, these apply where ever quality is required.
Question: How to know which tools are to use for a job?
Answer: Experience, and if you know about the tools insight well, you can easily understand the process.
A great piece of content. I really liked the way you covered all the QC tools in an article. Thank you for your effort.
Thank you, Gerry