PERT – Program (Project) Evaluation Review Technique is a project management tool & is a graphical representation of a project’s timeline.
PERT charts were introduced by the U.S. Navy consultants Booz | Allen | Hamilton in 1957 to guide a nuclear submarine project.
PERT is a technique in project management that we apply to manage uncertain activities of any project.
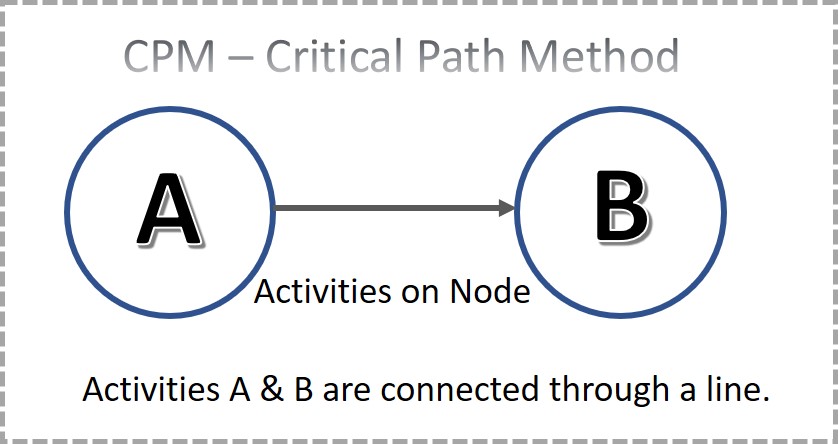
On the other hand, a Critical Path method – CPM is a statistical technique where we have a set of well-determined project activities.
Both PERT and CPM help the project manager of the stakeholders manage and control the project outcomes systematically.
A PERT chart is just a priority brand of network charts.
Quick Navigation
There are two Project Management Tools;
- Critical Path Method – CPM
- Program (Project) Evaluation Review Technique – PERT
Both are pretty much the same. It’s just a stylistic approach to represent.
![]()
Let’s see a detailed comparison;
For more understanding of AOA or AON, visit Network Diagrams.
The other major difference is the Critical path method uses the single point estimation whereas PERT uses three-point estimation called;
- Optimistic
- Most Likely
- Pessimistic
Like in the critical path, we say;
Activity A duration = 10 days
But in PERT, we use like;
- Optimistic = 7 days (fastest possible)
- Most Likely= 10 days (as a CPM)
- Pessimistic = 14 days (longest we assume)
Make sure this Optimistic and pessimistic may not be symmetrical. There is no such relation.
PERT Formula
We use & combine here;
- Optimistic
- Most Likely
- Pessimistic
PERT Method = (1xP + 4xM + 1xO)/6
Here, we typically give more weight to most likely.
By the way, we can modify it like;
PERT Method = (1xP + 4xM + 2xO)/7
We can also increase the most likely weight more like
PERT Method = (1xP + 6xM + 1xO)/8
Standard Deviation in PERT
We also calculate the standard deviation to calculate the variation on our average.
S.D = (O – P)/6
How to Draw a PERT Chart
Let’s see a simple example to draw a PERT chart. By the way, you need to play with complex networks as there is much software to help you out there.
Below is the table with activities duration & predecessors.
| Activity Name | Duration (Days) | Predecessor |
| A | 4 | None |
| B | 3 | A |
| C | 1 | A |
| D | 5 | B |
| E | 2 | C |
| F | 6 | D, E |
Before we get deeper, make sure to remember these points in PERT;
- A node is just an event or a point in time
- Activities are represented on an arrow or arc.
- Activities (arc) leaving a node cannot be started until the node’s activities are completed.
- Only a single started node outflows the activities, and a single ending node with an inflow of activities.
Step 1-: We need to draw the activities AOA. We need to keep the relationship, as you can see in the table. Here is what we will get;

Step 2-: Now, we need to number the nodes. If you got two nodes simultaneously, you need to prioritize horizontally like below; you will see I numbered nodes 3 & 4.
The rest is just a number from left to right.

Step 3-: Now, add your chart’s duration to figure out the critical path on that PERT network.

Here are two paths from start to finish
Path 1: A, B, D & F = 4+3+5+6 = 18 days
Path 2: A, C, E & F = 4+1+2+6 = 13 days
Hence Path 1 is the critical path with 18 days.
This is how we draw a PERT chart and calculate the critical path in PERT.
Note: This is a straightforward example of a PERT chart. You may calculate duration with a three-point estimation and also standard deviation if not given to you. This you can do with the formulas I have stated already.
If you need any more examples, then let me know in the comments.
Advantages of PERT Chart
As a Project Manager, you may need to draw a PERT chart for:
- To determine the critical path that helps to prioritize the tasks.
- To display interdependencies among activities.
- To estimate the project completion date.
- To handle and understand complex projects.
- To have better coordination among team members.
- To perform a what-if analysis that helps to identify uncertainties.
Disadvantages of PERT Chart
First of all, you must need an experienced professional to make estimates and logic; otherwise, it’s a pitfall to using PERT. There are also some disadvantages to using the PERT technique;
- PERT is Time Focused. It would help if you made precise estimations.
- PERT technique is labor-intensive & need professional resources
- It is tough to use PERT if you have projects with shareable resources.
- Once you finalize a PERT, then it is hard to change the relationship among activities.
- Hard to manage interdependencies for complex projects.
- As we need more resources and hence is expensive.
Difference between PERT & CPM
There are quite a few differences when we consider using any of these to apply to our project.
| Basis | CPM | PERT |
| Full Name | Critical Path Method | Program (Project) Evaluation and Review Technique |
| Meaning | CPM is a statistical technique, and we use it to manage the activities of a project. | PERT is a technique that we use to manage the uncertain task of a project. |
| Method | It is used to plan & control both cost and time. | It helps to plan & control time only. |
| Best for | Construction projects. Non-research project. Example-ship building, civil construction | Research and development projects |
| Manage | It helps to manage Predictable activities. | We use it for Unpredictable activities. |
| Orientation | This is an Activity-oriented technique. | This is an Oriented Event technique. |
| Crashing | We can crash the project later on | We cannot crash a project in PERT |
| Nature of jobs | Repetitive nature jobs can be handled | Non-repetitive nature |
| Time Estimates | One time estimate | We make here Three-time estimates |
| Model | CPM follows Deterministic Model | PERT follows Probabilistic Model |
Difference between PERT & Gantt Chart
I can say;
A PERT chart is drawn at the start of any project, while Gantt Chart helps track it.
Wrap Up
We use PERT if we have time priority and cannot delay any. But we use CPM to control both Time & cost simultaneously.
Both CPM and PERT are the two tools helping the project managers out there. Nowadays, we use to merge these and not rely on a single technique if possible, and we have project resources.