A Gantt chart is also known as a bar chart, represents a project plan by making each task into a bar and putting those bars into a schedule.
We can define a Gantt Chart as a bar chart that helps understand through a monitor and track project progress in terms of activities on the Y-axis & durations at the X-axis.
Some people also refer to a Gantt chart as Activity Chart & some even call it a Milestone chart!
I will provide you with Gantt chart excel templates to practice on and discuss how to make a Gantt chart in excel.
Quick Navigation
Brief History of Gantt Charts
As the name suggests that it might be the sole work of Mr. Henry Gantt, but we have some fascinating history and a lesson learned.
Gantt Chart was introduced by Henry Gantt? – No!Karol Adamiecki first developed this Chart tool in 1896; he called it a harmonogram. But he did not publish but later on, he did in 1931 but in the Polish language & hence could not get adoption and due recognition.
In 1912, Hermann Schürch discussed a construction project published in Germany, but these charts were without interdependencies, and although this type of work was common in Germany back then.
The Gantt chart we see and use today was improved along with task dependencies by Wallace Clark. He used to work in Henry’s firm and was considered as Henry Gantt’s disciple.
The lesson learned is that if you got a great idea, make sure to publish it immediately and in English! (Respect for all other languages, but English is a global language)
How to create a Gantt Chart
Gantt charts can be created on many software nowadays. Some are simple; others are fancy. But the main purpose of a Gantt chart to display the information of a Project visually.
Information on a Gantt Chart
Let us discuss a simple Gantt chart example as you can see below;
- Activities or Tasks
- Milestones
- Time Frame
- Data Date
- Actual Progress
- Activities Relationship or Inter-dependencies
- Legends
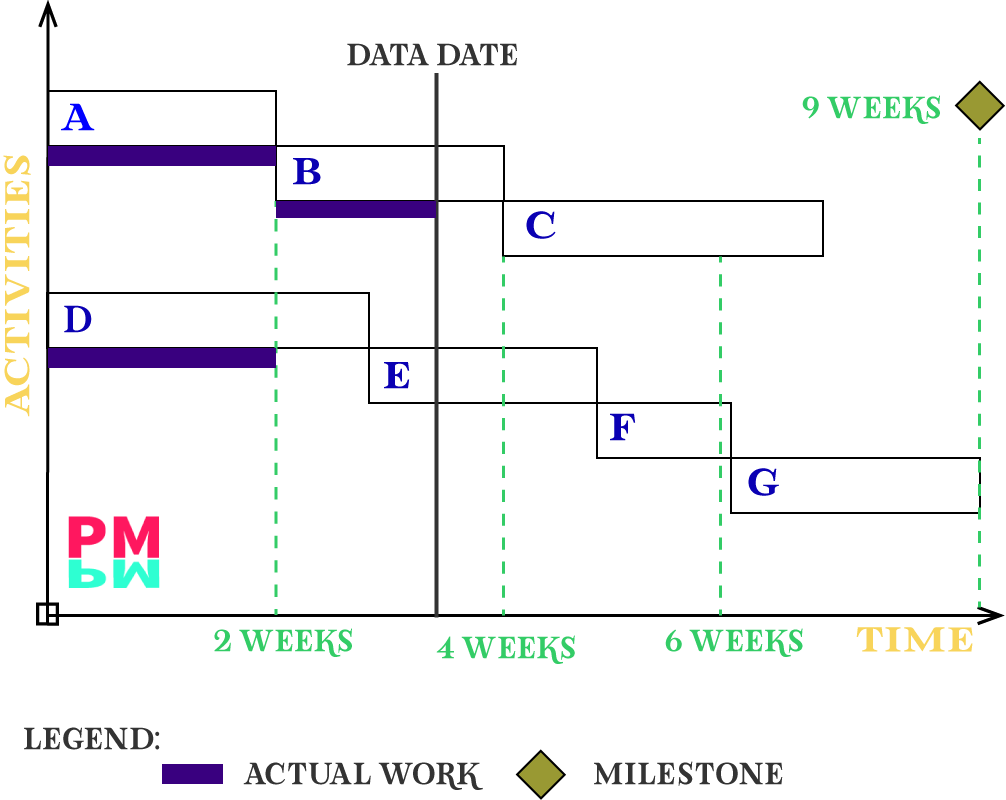
Here, you can see activities are plotted and Y-axis and following the time as per the dependencies pattern.
We also call it a Milestone Chart as sometimes we only display Milestones to report to top management for any big project. A milestone report is a top-level report that will display the Milestones to be achieved with time. Although a milestone is an event with zero duration, it will still show on a different time period.
How to Make a Gantt Chart in Excel
Below is a real-life chart, so to Draw on MS Excel, you need to have;
- Project ID
- Activities/Tasks
- Time Duration of Each Task
- Activities Relationships
- Milestones
- Progress of Each activity (If available)

Once we have all this information, we will put all the activities as per order, and also, we will define activities ID.
You can download from here, Gantt Chart Template in Excel.
Gantt Chart by Scheduling Sofware
The best is to use the right tools for the right work. Scheduling software companies have done tremendous jobs by developing these Gantt Charts automatically. This makes life easier for us.
Primavera P6 is a powerful scheduling software, and Gantt Charts are built in there. All you have to do is put the activities and tasks, and the bars will appear automatically.
Same you can do in Microsoft Project. Asta Power Project. In MS Word and MS PowerPoint, you have to do all the functions manually or try online sources to get a Gantt Chart.
I highly recommend using the attached MS excel templates if you are not good or don’t have access to planning and scheduling software like Primavera P6, MS Project, Asta power project, Tilos, etc.
A Gantt Chart drawn by these tools can give you better clarity as it shows;
- Project Summary
- Work Breakdown Structure & Summary
- interdependencies or Relationships
- Planned time
- Actual progress
- Baseline Schedule
- Resources Assigned (Cost, Manpower, Machinery)
- Critical Tasks
- Critical Path
Application of Gantt Charts
Gantt Charts are very simple to understand, and anybody can understand at a glance that what is ongoing. I can say it is the simplest of the reporting documents that can be one for all stakeholders. Industries, firms, organizations make sure to use Gantt charts for their scheduled tasks. Gantt charts are used in project management, Information Technology and RnD teams, Marketing, Engineering, and manufacturing. I was first introduced to Gantt Charts in our Obeya Meeting – Terrible Introduction was that in a process industry!
Gantt Chart DisAdvantages
Gantt chart is a blessing and one of the best tools for planning, controlling, and the most important, for reporting. This helps as a message on board, to-do list but in wider scenarios it ;
- Promotes transparency among stakeholders
- It gives a clear picture of the current situation of project or projects
- Improves communication among the stakeholders
- Helps a project manager to improve his/her Manageability, Flexibility, Creativity, Time Management
- It helps to understand and to avoid resource overload
- Helpful to measure the progress of projects
- helps to fast track or crash the project
- Creates a sense of accountability
- Boosts flexibility
- Helps team Coordination and ultimately the motivation
Gantt Chart Advantages
To be honest, I don’t see any disadvantage of using a Gantt Chart, but for the sake of understanding will list some and discuss; you are requested to share your thoughts in the comments;
- To create a Gantt Chart, you need a skilled person
- To create a Gantt Chart, you need Software as it draws a complex chart on paper that will be tough to handle. Simple ideas we draw on paper first.
- You need to update these charts periodically on—Daily, weekly, or monthly basis.
Wrap Up
No one can deny the importance of Gantt Charts once you are familiar with the importance. These are highly used in Project Management. It helps to save time through better communication among the stakeholder. A tool is just useless if you don’t know how to use it properly.
Video Guide
Pareto charts are explained in concise scenarios. Can you please refer and material that how we can utilize in practically? Thanks for the templates though. Appreciated!
Thank you, Mr Rao. Yes, I will definitely in future posts.
It is sad that the person initially got the idea could not publish it under his name only because of the English language. Anyways he is still in history books. Gantt is also available in history now. Appreciated your research and a brilliant write up. Keep the good things around boy.
Thank you very much for the appreciation, Mr. William
I always thought it is by Gantt but the credit should be to that person who discovered initially. Anyways lesson learned but in a hard way. Well researched article though.
Thank you for your help. Now I can understand it easily. Henry Gantt took all the credit but history says otherwise.
May I copy your Gantt Chart Graph for my assignment, please.
Henery Gantt did a wonderful job by copying others work!
Thank you for researching and explaining in an easy way.
Great content and well constructed. Going to copy some stuff for my presentation. Gantt Charts are definitely one of the essential tools in Project Management.
Thank you giving an insight about Gantt Charts importance. Indeed a worth reading.
Henry Gantt took all the credit because of his English approach. Noted.
Btw, one of the best article on Gantt Charts explanation.